I’ve written about the power of simple bar charts on my marketing technology site. Their superpower is telling a clear, simple story. More complicated ones may require stacked bar charts, like the one below. It’s shows the way TV streaming competitors have whittled away at Netflix’s market share supremacy, from this excellent post by The Entertainment Strategy Guy. The chart could stand a makeover.
The essay is full of visualizations to help you understand this erosion, but I’m focusing on ways to improve his lead graphic only, and along the way teach you how to improve your own stacked bar charts. Here is the original:
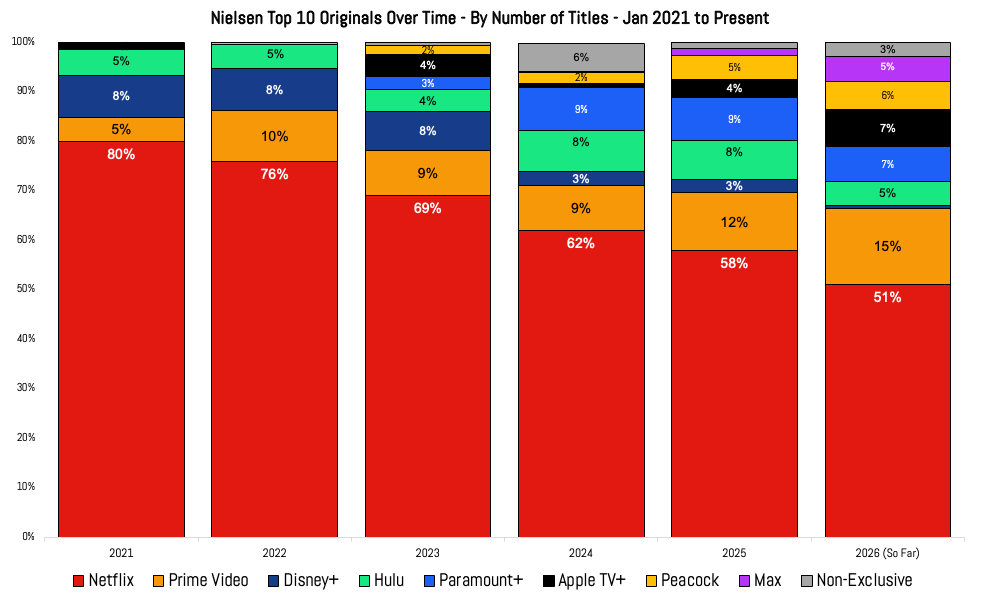
You may think this is clear as-is. You’re mostly correct. His choice of colors is wise, since red is impossible to overlook, drawing your eye to Netflix’s percentage of Top 10 Originals over the years. And placing that bar at the bottom of the stacks helps show the platform’s diminished share with crystal clarity. But consider these two questions:
Question 1: How do I remember which streaming platform corresponds with which color?
By including the competitors in the stack, instead of making a simpler bar chart like the one I produced below, the author invites you to understand the market share each has stolen from Netflix over the years by producing popular shows …
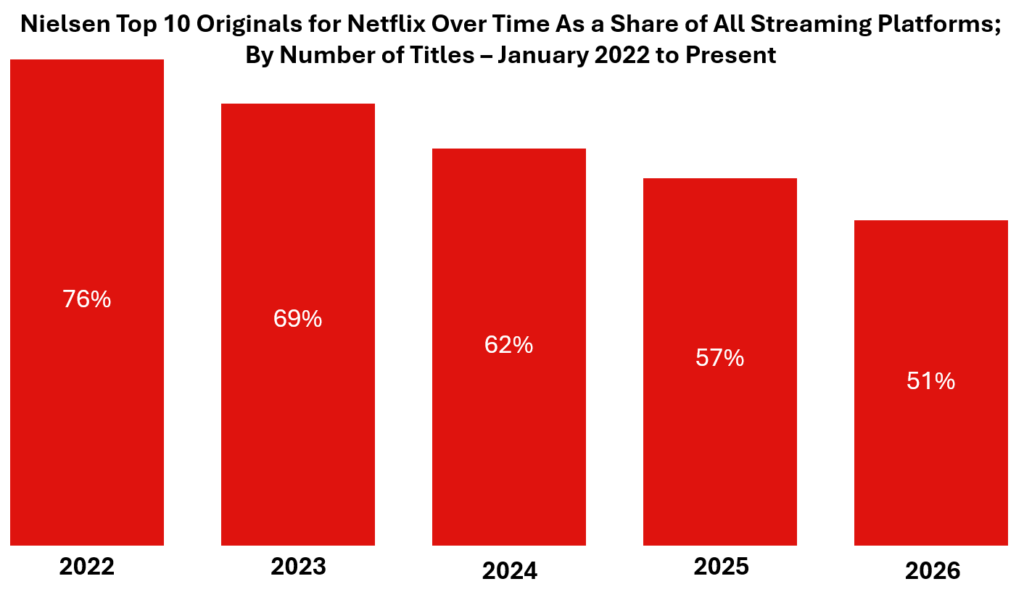
… But that’s not what was in that essay.
With the legend at the bottom of the stacked bars, your attention needs to travel up and down repeatedly, like a series of annoying but absolutely essential footnotes.
Playwright Noël Coward could have been referring to legends like this instead footnotes when he famously wrote, “Having to read footnotes resembles having to go downstairs to answer the door while in the midst of making love.”
Not a satisfying experience!
Finally, the Americans with Disabilities Act might also scold the author for making those colors a challenge for the colorblind. And speaking of those colors, Prime Video’s and Peacock’s are awfully similar to each other!
The solution to those challenges is to replace the original chart with this:
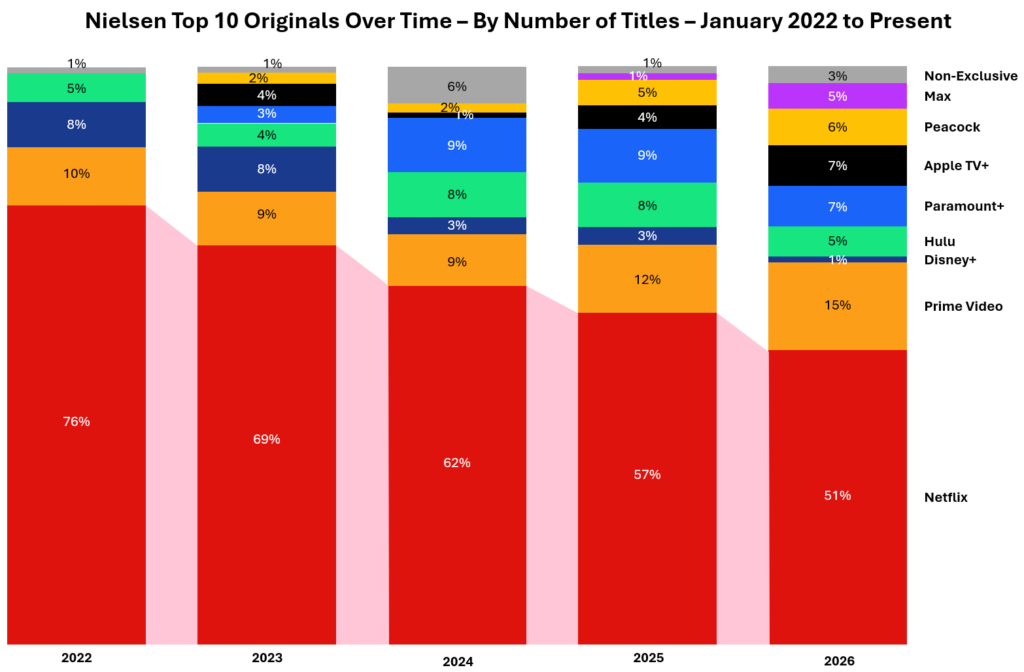
You may think the pink ribbon joining the Netflix bars is overkill, and you’d be right, if not for human curiosity. You’ll see why I’ve included those connecting polygons shortly. The bigger improvement over the original is the total elimination of the legend, replacing it with data labels for each of the platforms, on the right. Much cleaner!
I might have opted for labels on the left, but over the years more competitors have stepped in. Regardless, with these data labels, cognitive load is greatly reduced. You may also notice that to make room for this right margin addition, I’ve eliminated the year 2021 entirely. This simplification does not take anything away from the insight the chart communicates.
Question 2: If the other platforms are important enough to include in stacked bars, how can we satisfy readers who have follow-up questions about them?
Just as popular TV shows will spawn spin-offs, stacked bar charts almost always invite questions. The solution is to build versions of the original chart. Why not cram more into the original? Remember that best practice dictates you should include only one insight per visual. In this case it’s the declining share of hit shows on Netflix over the years. Other insights call for iterations.
For instance, the insight you might wish to communicate is that in terms shrinking percentages over the years, it’s Disney+ that has experienced an eight-fold loss — a much greater shrinkage compared to its 2022 high compared to Netflix over the same years.
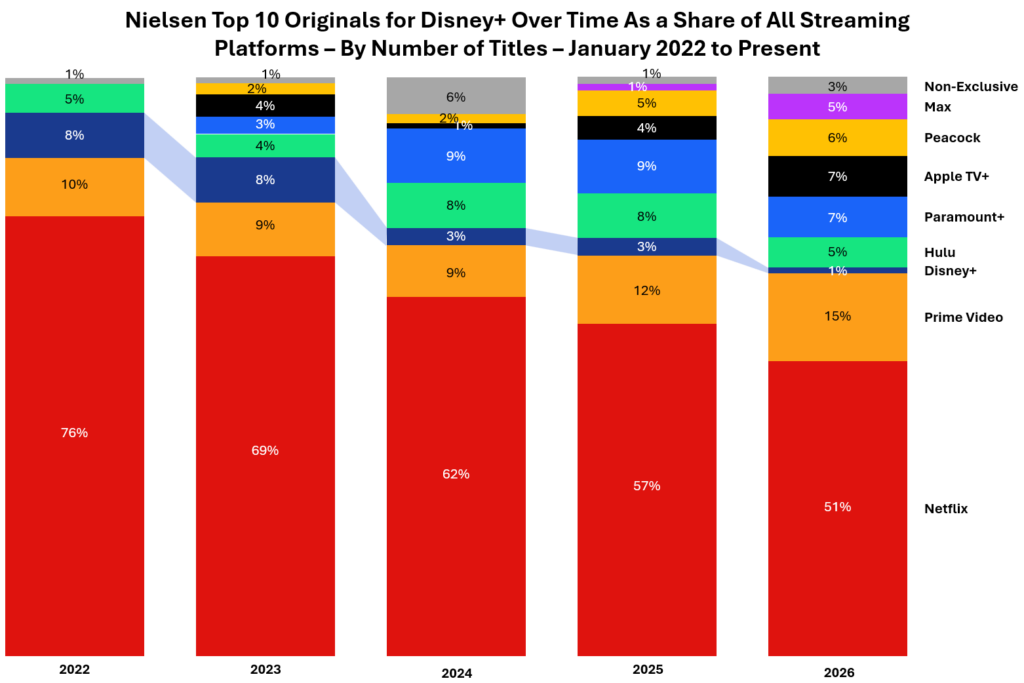
Without this ribbon technique you might not notice just how dramatically Disney+ is losing in the battle for the most Top Ten original programs.
You may ask, What are those grey bars at the top, the Non-Exclusive programs? As the Entertainment Strategy Guy explains, they are one-time originals that have strayed from their parent platform and are, that year, on more than one platform. He explains, “Grey’s Anatomy is probably the best example of a non-exclusive show, since at some point, Nielsen started tallying its Hulu viewership as well, but that show still likely generates most of its hours on Netflix.”
If I were presenting a deck with those insights, I would definitely do some fiddling with the order of the platforms and merge two of them, to show the evolution over time of the David Ellison acquisitions in his recent merger (funded by his father, founder of Oracle). Here’s what his Skydance shows look like in the annual Top Ten competition, in both the years leading up to the merger, and today:
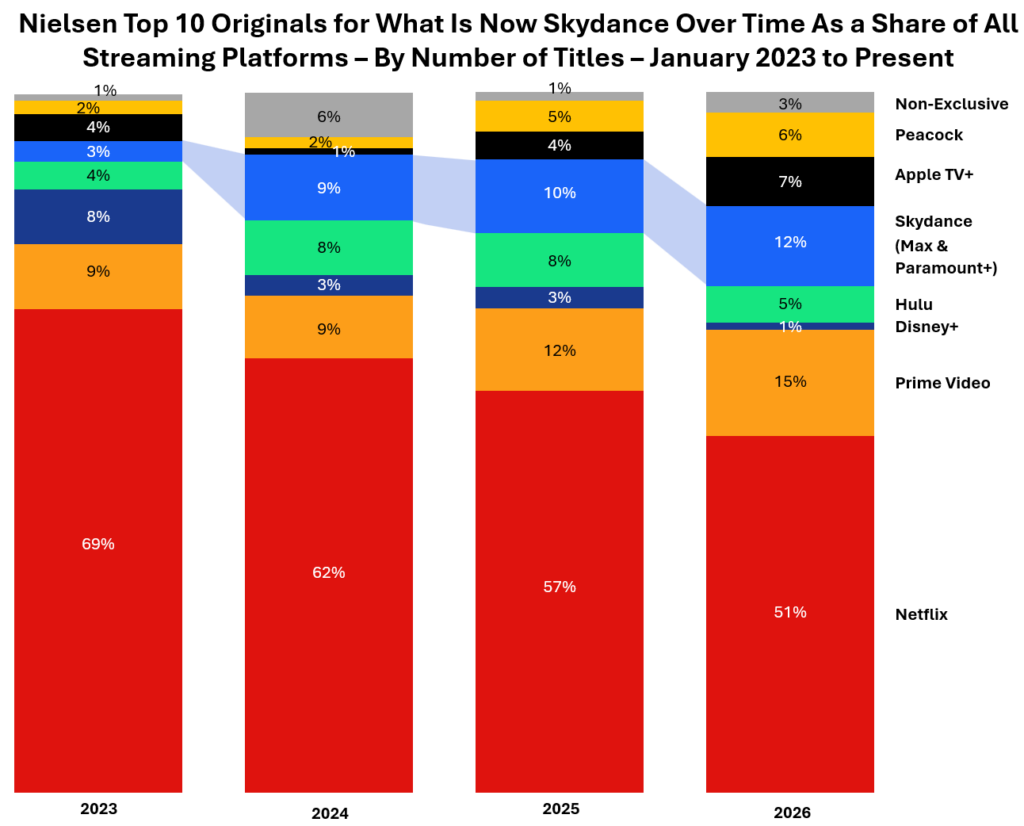
In combining the intellectual properties owned by HBO / Max and Paramount+, Ellison has become a formidable foe to Netflix — almost as big as Prime Video in terms of hit original programming.
The question now is, should there be an economic downturn and / or a loss of his father’s largesse, how long can David keep it?